Introduction
This field-ready guide to the Kalahari Desert delivers printable A0 maps, GeoTIFF satellite overlays, MBTiles, and curated GPX/KML routes for safe, practical navigation across Botswana, Namibia, and South Africa. It explains using time-stamped imagery to check conditions in the Okavango Delta and the Makgadikgadi Pan, preparing GPS/paper backups, and embedding community-consent metadata.
Quick facts & concise orientation
- Area (approx.): ~360,000 sq mi (≈930,000 km²).
- Main countries covered: Botswana, Namibia, and northern South Africa.
- Main landscapes: longitudinal dunes, sand sheets, salt pans (hard and soft crust), ephemeral channels, and the Okavango wet fringe.
- Essential deliverables for travel: A0 300 DPI PDFs, GeoTIFF satellite basemaps (time-stamped), MBTiles for offline viewers, curated GPX/KML route packs, vector layers for conservancies and fuel points, and clear license/attribution metadata.
This map pack is both a safety resource and an interpretive product — it must show the difference between legal, permitted travel routes and ecological or sacred places that require permissions or should be left off public releases.
Where the Kalahari sits on the Africa map
Think of the Kalahari as an interior bowl on the southern African subcontinent. The basin is hemmed in by higher ground and plateaus, with the Okavango to the northwest and the Makgadikgadi Pans to the central-east. These two features demonstrate the Kalahari’s patchwork nature: some sectors are seasonally inundated and verdant, others are hard, white salt crust, and others still are wind-swept red sand. For trip planning, always overlay political (country/district) and ecological (dune fields, flood extents, pan margins) layers separately — they serve different tasks (permits vs. travel safety).
What a professional map pack must include — at-a-glance
A high-quality map pack is three things: (1) a readable print design, (2) a consistent digital stack, and (3) complete provenance and licensing. Deliver the following components together:
- A0 printable PDF (300 DPI) — two main print variants: driving map (tracks, fuel points, scale bars) and field map (contours, verified water sources, camp icons). Export with embedded fonts and a PDF/X-4 workflow for print reliability.
- GeoTIFF satellite basemaps — recent composites from Sentinel-2 and Landsat, plus optional radar to bypass clouds. Provide full resolution and a downsampled preview for quick checks.
- MBTiles — tilesets packaged for offline use (Avenza, Gaia, OsmAnd are common targets). Include attribution tiles with vector overlays.
- GPX & KML route packs — curated loops and approach tracks with waypoints, timestamps, and difficulty metadata.
- Vector shapefiles / GeoJSON — conservancy boundaries, protected area polygons, fuel points, boreholes, fences.
- Waypoint & README pack — CSV/GeoJSON list of waypoints (lat/long, difficulty, vehicle type, fuel/water notes), plus a README with source dates and licenses.
- License & use instructions — clear attribution (e.g., NASA, ESA, Landsat, Sentinel, OpenStreetMap, national datasets) and a simple license matrix (sample CC-BY-NC for free packs; commercial license for resellers; community consent terms for sensitive layers).
Why each matters: print is the ultimate fail-safe; GeoTIFFs let you validate conditions; GPX tracks are what devices follow; vectors let you toggle sensitive info; a README gives trust and defensibility (who mapped what, when, and under what permission).
Political vs ecological mapping — how to design layers
Design your data model so political and ecological layers are separate files and separate concerns.
- Political layers (shapefiles/vector): admin_0, admin_1, Secondary roads, towns (for fuel/permits), permit checkpoints. Use these for logistics, permit planning, and legal context.
- Ecological / hazard layers (rasters and time-series): dune_field polygons, pan_extent rasters (time-stamped), flood rasters (derived from Sentinel-1 SAR or Sentinel-2 NDWI), vegetation indices (NDVI). Use these to assess actual travel risk.
Tip: Ship political layers as static vectors and ship ecological layers as time-stamped rasters (e.g., pan_extent_2025-02.tif). That way, a user can swap in a fresher raster before departure.
Key landscape features to map
Okavango Delta — the dynamic inland delta
The inland delta is a seasonal pulse system fed by distant rains. Time-series satellite imagery is indispensable: channels, reed-beds, and flood edges change year-to-year. Map entry/exit points, authorized lodges, and seasonal marshes. Use imagery to find safe crossing points and to avoid approaching reed fringes that can hide water.
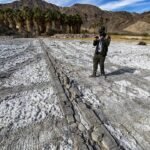
Makgadikgadi Pan — salt crusts and seasonal chaos
The Makgadikgadi is not a single smooth plane; it’s many pans (Sowa, Ntwetwe, Sua) whose crust strength varies. In dry seasons, some tracks cross safely; after rains, those same surfaces become viscous traps. Map crust history (where vehicles have crossed safely) and flag all crossings with a caution grade.
Etosha Pan — a Kalahari flank
This northern salt basin demonstrates how pans interface with protected areas. Map the protected boundaries and staff access roads used by authorized tourism operators to avoid illegal routes and to keep wildlife disturbance low.
Central Kalahari Game Reserve — remoteness and rights
This reserve is vast and remote. Historical legal disputes involved land rights and community access. For any public map release, avoid placing precise community coordinates unless you have written consent. Add metadata describing consultations and consent.
Satellite & GIS insights: how imagery improves safety and planning
Why imagery matters: a fresh satellite composite will tell you if a pan is bone-dry, partly flooded, or an impassable mud trap. A time-series reveals dune migration, recent channel change, and where green-up signals concentrated wildlife (which can affect both safety and viewing opportunities).
Recommended data sources & use-cases
- Sentinel-2 optical for high-revisit, multispectral imagery — great for NDVI and recent color composites.
- Sentinel-1 SAR radar to detect standing water beneath cloud or dusky conditions.
- Landsat for long-term trend analysis and change detection.
- NASA Worldview / Earthdata for quick visual checks and rapid composites.
Practical GIS steps
- Pull the last 3 months of Sentinel-2 and Landsat surface reflectance.
- Generate NDVI and NDWI (water index) rasters to highlight vegetation and standing water.
- Run a simple change detection overlay: identify pixels where NDWI or radar backscatter indicates recent inundation.
- Overlay GPX tracks and flag segments intersecting the newly flooded classes.
- Export GeoTIFF basemaps cropped to your A0 print extents and embed a timestamp and source metadata in the file name.
Pro tip: Before departure, load a recent false-color composite into your phone app or print a small A3 “last 60 days” insert for quick checks.
How to produce reliable A0 printable maps
Paper & print specs
- Size: A0 (84.1 × 118.9 cm), 300 DPI for detailed printing.
- PDF export: Use PDF/X-4, embed fonts, flatten transparencies where necessary for older RIPs.
- Color: Use CMYK conversion for print; include a near-spot color for key layers (e.g., red for dunes, blue for water).
- Margins: Include printer bleed and a 5 mm safety margin for folding or framing.
Two primary print variants
- Driving map — large-scale tracks, fuel stops, mileage rings, scale bars, 4×4 difficulty icons, and fuel/water distances. Minimal topography.
- Field map — contours, camp sites, contour intervals, verified water sources, boreholes, and walking paths. Add a small inset for quick GPS coordinates.
Print deliverables
- Full-size A0 PDFs for wall planning.
- Folded A2/A3 “pocket” maps for field use (key pages extracted and arranged into a folded pack).
- Laminated and waterproof options are recommended.
Digital & GPS: coordinate systems, devices & offline maps
Coordinate systems
- Provide GPX/KML in WGS84 (EPSG:4326) for compatibility with Garmin and phone apps.
- For local measurement (distance/area), provide UTM-projected GeoTIFFs keyed to the appropriate UTM zone.
Offline maps
- Build MBTiles (tileset) for Avenza, Gaia, and OsmAnd consumers. Keep a low-res vector tile for base and separate high-res satellite tiles for large-screen checks.
- Include a simple overlay layer for sensitive community data that can be toggled off by default.
Devices & redundancy
- Bring multiple navigation options: a phone with downloaded MBTiles, a dedicated GPS (Garmin) with GPX loaded, and paper maps. Export GPX to Garmin and test the route on-device before departure.
- Satellite comms (InReach/Spot) are recommended for remote ops. Add emergency center coordinates and a medevac procedure document to your README.
Landscape features: how to map dunes, pans & ephemeral rivers
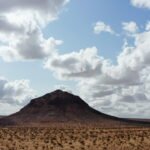
Dune fields
- Map dune ridgelines; label longitudinal (linear) dunes and mobile sand sheets.
- Mark known sand-driving sections and indicate recommended tyre pressures and recovery gear.
Pans
- Classify pans by historic crust strength: firm / variable/soft. Use field reports and satellite reflectance to seed these classes.
- Add a seasonal attribute (e.g., season_safe = “dry only”) and update after each rainy season.
Ephemeral channels & rivers
- Map channels with a “historic flood extent” polygon layer using Landsat time-series.
- Flag tracks that intersect historical channels with a seasonal access note.
Climate, seasonal patterns & mapping implications
Seasonal rainfall window
- Austral summer rains (roughly November to March) drive the major changes: Okavango floods, pan inundation, and closed tracks.
- Charts and overlays: produce a seasonal access raster that sets tracks to open/closed based on month and a confidence score derived from historical flood extent.
Temperatures & wind
- Summer heat spikes (>35°C) and cold winter nights (May–August) affect vehicle performance and human safety.
- Wind regimes reshape dunes — include a dune-migration layer for multi-year planning.
Map implication
- Offer a pre-built seasonal toggle in the digital viewer that disables tracks likely impassable in wet months and highlights wildlife corridors during migration pulses.
Flora, fauna & mapping layers for wildlife safety
Vegetation layers
- Provide tree/woodland polygons (mopane, acacia zones) and grassland extents. These help with shade planning and also indicate where game may concentrate.
Wildlife corridors & critical habitats
- Map known migration routes and breeding congregations (e.g., seasonal flamingo gatherings on flooded pans). Use time-stamped data and flag areas where low-impact travel is required.
Safety mapping
- Add night-driving advisories near wildlife corridors and mark official park boundaries explicitly to avoid accidental boundary breaches.
Human history, ethics & community-first mapping
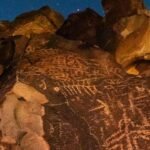
The Kalahari is home to San and other communities with millennia of place-knowledge. Ethical mapping is non-negotiable.
Consent & community data
- Never publish precise community coordinates or sacred-site locations without informed, documented consent.
- When sharing community layers, include a consent metadata stub: consent_date, consent_scope, contact_person, and benefit_share_terms.
Benefit sharing
- Offer free community-use datasets, revenue shares, or restricted licensing that funnels revenue back to community projects.
Legal context
- For areas such as the Central Kalahari, consult local legal rulings and park authorities before publishing any community location data.
Survival & hazard mapping — what to highlight on every deliverable
Essential safety layers (both print and digital):
- Verified water points (boreholes, hand-dug wells) with status and last-checked date.
- Fuel points (Maun, Gweta, Nata, Ghanzi, Upington, Orapa) with 24-hour availability status and contact phone numbers where available.
- Mechanic towns — local repair shops and parts availability.
- Emergency pickup coords and medevac staging points.
- Hazard flags — seasonal floods, soft-pan zones, high-risk night-driving corridors.
Vehicle kit & packing checklist (for map metadata & trip checklists)
- Full-size spare wheels (x2), snatch straps, maxtrax / recovery boards, air compressor, jerry cans for fuel, water containers, satellite comms, comprehensive first-aid kit.
Trip planning advice
- Plan fuel legs conservatively; distances between reliable fueling points can exceed 300 km.
- Carry redundant comms and power; a single failure in an off-grid desert can cascade quickly.
Tourism layers: attractions, permits & map toggles
Top attractions to map
- Okavango access points and authorized operator docks.
- Makgadikgadi Pan features — Lekhubu, baobab islands, meerkat viewing points.
- Central Kalahari remote camps and community-run tours.
Layer ideas
- Guided-only tracks (hidden by default).
- Birding zones (seasonal).
- Offer permit-checkpoint layers and conservancy rules as toggleable vector overlays in your web map.
Environmental issues & conservation best practices for mappers
Threat layers to include
- Mining concessions, exploration blocks (publicly available spatial datasets).
- Veterinary and boundary fences that fragment migration routes.
- Protected-area boundaries and their enforcement zones.
Best practices
- Provide transparent provenance: include dataset authors, collection dates, and lineage.
- Toggle sensitive information off by default and require user acknowledgment for sensitive layers.
- Provide community access and share revenue where appropriate.
Case study (condensed): mapping, land rights & community outcomes
A community-engaged mapping initiative in the Kalahari combined community workshops, GPS participatory mapping, and consented publishing. The result: a tourism route layer that funneled income to local guides, a community-maintained borehole layer, and a restricted sacred-site layer that reduced trespass incidents. Document consultations and keep a consent ledger in your pack.
Tables: Map pack feature comparison
| Feature / Pack | Free Sample Pack | Field Pack (Paid) | Pro GIS Pack (Paid) |
| A0 300 DPI PDF | ✓ (A2 sample) | ✓ (driving & field) | ✓ (custom print extents) |
| GeoTIFF overlays | Low-res | High-res recent | Multi-date composites |
| MBTiles (offline) | — | ✓ | ✓ (custom tiles) |
| GPX/KML routes | Sample GPX | Full GPX + waypoints | Full GPX + vector layers + metadata |
| Community layers | — | ✓ (public) | ✓ (consent-checked) |
| License | CC-BY NC | Commercial option | Commercial + API |
Quick reference — seasonal access & hazards
| Season | Access notes | Hazards to map |
| Wet (Nov–Mar) | Okavango floods; many tracks closed | Flooded tracks; soft pan mud |
| Early Dry (Apr–May) | Green landscapes; some pans soft | Soft crust remains after rains |
| Dry (Jun–Sep) | Best vehicle access; wildlife viewing | Cold nights; dusty winds |
| Late Dry (Oct) | Pans firm; migratory pulses begin | Windstorms shift dune crests |

Sample GPX route description — Makgadikgadi Loop
- Name: Makgadikgadi Loop (self-drive camping)
- Length: ~400–600 km depending on variant
- Vehicle: High-clearance 4×4 recommended
- Warnings: Variable crust strength; check satellite imagery and local reports before crossing.
Waypoints
- Start: Gweta (fuel & supplies)
- Crossing: Sua Pan entry — seasonal check required.
- Camp: Baobab iIslandnear Lekhubu — GPS coordinate and permit note included.
Interesting facts, satellite snapshots & narrative hooks
- The Okavango functions as an inland delta: floods sourced in the Angolan highlands flow slowly into Botswana and expand to create seasonally emergent islands. Time-series composites make this pulse visible and actionable for route planning.
- The Makgadikgadi pans were once part of a massive paleolake — they flood irregularly and can attract flamingos and mass ungulate movements when conditions align.
Use a “last 90 days” satellite snapshot on your landing page to increase user trust and click-through by signaling recency.
Pros & Cons
Pros
- Better maps equal safer travel.
- Satellite overlays reduce the risk of pan/mud entrapment.
- Community-inclusive mapping improves ethics and local benefit.
Cons
- Fast seasonal change requires frequent imagery updates.
- Publishing precise community coordinates without consent risks harm.
Practical steps: how to prepare a Kalahari map for a trip
- Download an A0 PDF (choose driving or field).
- Acquire recent satellite GeoTIFFs (Sentinel-Landsat composite from the last 3 months).
- Load MBTiles into your offline app (Avenza/Gaia/OsmAnd) and test offline.
- Import GPX routes into Garmin/phone; verify fuel, water, and emergency points.
- Print essential pages (route + emergency contact sheet) on waterproof paper.
- Confirm permits & conservancy rules.
- Carry redundant comms and power; bring a satellite device if remote.
FAQs
A: The Kalahari covers roughly 930,000 km² across much of Botswana and parts of Namibia and northern South Africa; use political+ecological overlays for exact travel boundaries.
A: In the dry season, many sections are crossable, but conditions change quickly. Always check recent satellite imagery and local reports,s and never attempt crossings without current GPX routes and recovery gear.
A: Yes — curated GPX/KML packs (Red Dune, Makgadikgadi loop, Okavango approaches) should include difficulty, fuel points, and emergency coordinates. Always verify with recent imagery.
A: Community and sacred-site coordinates should never be published without explicit, informed consent. Ethical map packs include community-validated data and sometimes withhold precise coordinates to protect those sites.
Conclusion
Use layered deliverables (A0 PDFs + GeoTIFFs + MBTiles + GPX) and refresh imagery frequently so routes reflect real conditions; keep sensitive community layers toggled off by default and document consent. Always withhold precise community coordinates and consult local stakeholders when mapping fragile areas like the Central Kalahari Game Reserve.