Introduction
This practical guide delivers a ready-to-use, GIS-grade map pack and a Reproducible mapping workflow for the Arabian Desert. Whether you’re designing a print poster, embedding an interactive map, or running spatial analysis, the pack includes layered SVGs, cleaned GeoJSON, KML for Earth clients, and high-resolution A0/PDF exports — all with a machine-readable manifest that documents provenance, CRS, licenses, and checksums.
Why a great Arabian Desert map matters
- Precision — allow users to download vector and spatial files (SVG, GeoJSON, KML), so designers and analysts operate on exact geometry instead of a flattened bitmap.
- Recall — surface searchable content (alt text, caption, metadata manifest, JSON index) so research discoverers and bots can find your assets.
- Explainability — include a reproducible methods section (data sources, preprocessing steps, classification thresholds) so journalists and researchers can evaluate and cite your work.
Treat every downloadable file as a provenance-bearing serialization of your “model weights” — the polygon attributes, the hillshade tiles, the label hierarchies. Provide a human- and machine-readable manifest (JSON) that lists file names, CRS, last-updated date, license, and MD5 checksums. That manifest is what other sites will link to and what will make your pack earn backlinks.
Quick facts at a glance
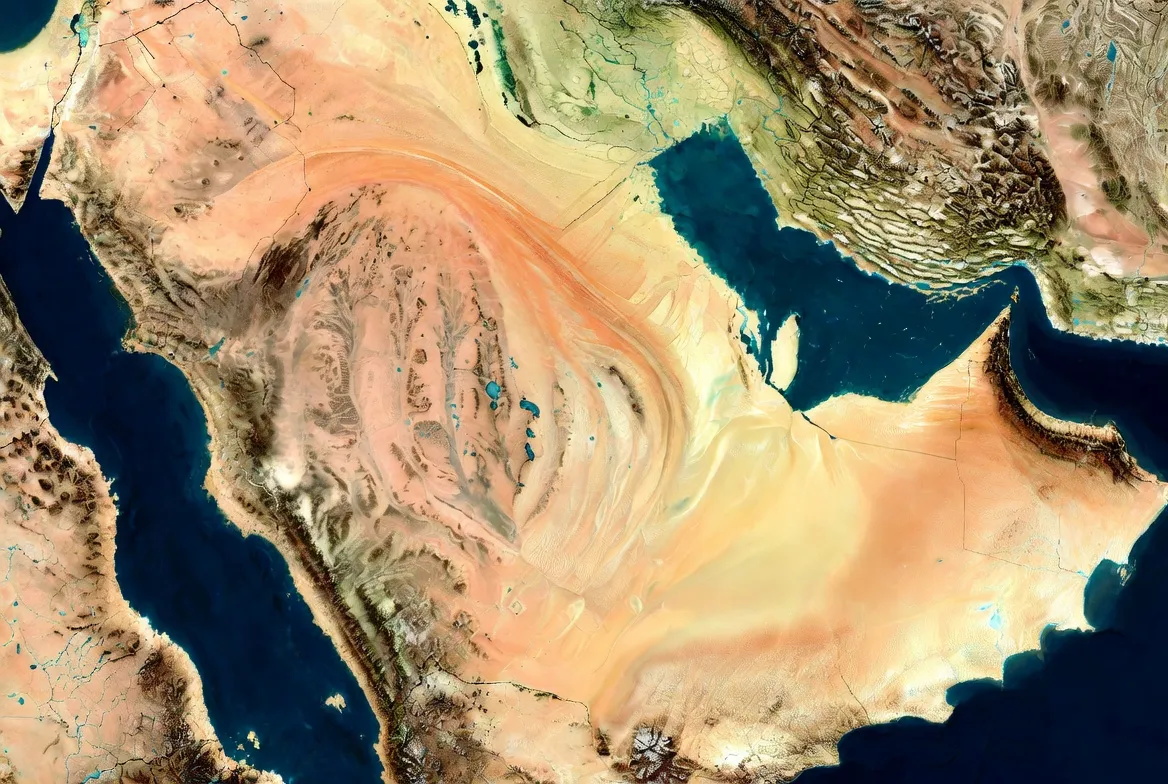
- Approximate coverage (entire region): ~2,330,000 km² (900,000 mi²).
- The largest sand sea is shown prominently: the biggest continuous erg (the Empty Quarter).
- Major sub-ergs highlighted: the northern crescentic erg, the coastal ridged erg, and the corridor linking them.
- Useful file types: Leaflet/Mapbox embed, layered SVG, cleaned GeoJSON, KML, A0/A1/A2 print-ready PDFs.
- Pro tip (printing): reproject vectors to a local metric CRS (UTM appropriate zone) before tiling and preparing crop marks.
UX & interactive features
Imagine the map UI as a tokenizer + model pipeline that converts user interaction into exports:
Essential layer controls (toggleable tokens):
- political boundaries (admin layers)
- dune extents (vector polygons derived via classification)
- hillshade (DEM-derived raster)
- wadis & ephemeral rivers (line features)
- oases & settlements (points)
- protected areas (polygons)
- photo points (point features with image lightbox)
Export & call-to-action features:
- Export visible layers as GeoJSON (serialize current session)
- Download an SVG snapshot (current view, preserved layers, and labels)
- KML export to open in Earth clients
- Print button to render A0/A1/A2 PDFs (tile-aware for print shops)
- Licensing CTA: CC BY-SA baseline + paid commercial license option
To make these functions frictionless, think of the client as a stateful inference engine: it keeps a URL-encoded state (layers, extents, opacity) so a URL or iframe Reproduces the same view and can be used as a shareable “prompt.”
Download pack
Offer a download bundle named something like: Arabian Desert Map — Download Pack (SVG, GeoJSON, KML, A0 PDF) containing:
- Full layered SVG (political, dunes, hillshade, labels) — editable in Illustrator.
- GeoJSON: dune polygons, oasis points, protected areas (feature attributes: id, source, confidence, date).
- KML: simplified and schema-reduced for Google Earth import.
- A0 & A1 PDF posters + tiled A2 PDF with crop marks and bleed.
- Starter PowerPoint: vector map slide, legend slide, title slide.
- README.txt (license text, repro steps, data citations, recommended projection for printing).
- JSON manifest (files, CRS, license, checksum, update date).
License: default CC BY-SA 4.0 for editorial/academic use, with a contact route for commercial licensing and bespoke exports.
The mapping pipeline — reproducible methods, framed as an NLP training pipeline
Mapmaking for a large desert is a data engineering + model training exercise. Here’s an NLP-style pipeline you can re-run:
Data ingestion
Pull administrative boundaries, places,s and road labels, DEMs, and satellite imagery. For administrative basemaps, use well-established public datasets; for elevation, use global DEM products. protected area boundaries, use the authoritative global register of protected areas. For place names and local features, incorporate community-mapped sources.
Preprocessing
• Mosaic and clip satellite tiles to your AOI.
• Reproject DEM tiles to a working CRS.
• Normalize labels: reconcile multilingual names, remove duplicates, set priority (official > community > derived).
Feature engineering
• Generate hillshade from the DEM (GDAL or QGIS).
• Compute indices (e.g., a simple NDVI and NDWI) from multispectral imagery as features to separate sand from vegetated or rocky surfaces.
• Use temporal composites to avoid short-term artifacts (e.g., clouds, ephemeral water).
Supervised classification
• Train a pragmatic classifier (random forest or small CNN) on labelled patches: dune, rock/hamada, sabkha, shallow salt, irrigated oasis, built settlement.
• Augment with manually drawn truth polygons in critical areas (dune edges, coastal sabkhas).
Vectorization & simplification
• Vectorize raster dune masks to polygons.
• Simplify geometry using topology-preserving algorithms to make SVGs small and clean for editorial use.
• Tag each polygon with a confidence field and an attribution field (source, date).
Validation & QA
• Cross-check dune polygons against higher-resolution imagery in sample tiles.
• Use field reports or published literature for tricky coastal sabkha vs. wetland classification. Where field data are sensitive, mask precise coordinates and instead label approximate regions.
Layout & composition
• Load the final vector layers into QGIS for layout.
• Export layered SVG, then polish typography and label placement in Illustrator.
• Create export scripts to produce GeoJSON and KML variants; create tiled print PDFs for A0/A1/A2.
Packaging & serving
• Host GeoJSON on a fast CDN and publish the manifest.
• Serve hillshade tiles at moderate zoom levels for the web, and provide a higher-res hillshade download for poster printing.
• Offer an embed endpoint (iframe) that encodes the current state so publishers can easily reuse the map.
Citations for the source datasets used in step 1: Natural Earth (admin basemaps), SRTM (DEM), WDPA (protected areas), and OpenStreetMap (labels).
Classification: dune typology as label taxonomy
A useful label set (your ontology) might be:
- star dune
- longitudinal dune
- crescentic / barchan
- longitudinal field (erg)
- hamada/rock plateau
- sabkha / saltflat
- wadi (ephemeral river)
- oasis (date palms / irrigated)
- protected_area
- human_settlement
- road/track
Store the label taxonomy in a JSON schema and make it machine-readable so other labs can map their own taxonomies to yours.
Major desert profiles
The largest continuous sand sea — our Empty Quarter erg (highlighted with a bold filled polygon and high-resolution hillshade inset). On web maps, provide a zoomed-in hillshade tile where dune morphology is dense, and the hillshade reveals crest curvature and slip faces.
The northern crescentic erg —shows crescentic dune forms near the foothills. Use typology styling (patterned fills or subtle hatch) to indicate crescentic vs. longitudinal types.
The coastal photogenic erg — provides a photo-point layer for campsites, ridgelines, and scenic wadis. Photo popups should include small licensing notes and alt text.
(Anchors, oases, and gateway cities are included as point features with pop-up metadata. For sensitive infrastructure like major oilfields, annotate for context only and do not provide access coordinates.)
Place-based map markers
Include single-point features for major anchors and gateways; do not embed sensitive coordinates for vulnerable heritage sites or private infrastructure. For example, mark the large oasis cluster on the lower erg edge, and the primary coastal gateway city as a transport hub. Where archaeology is sensitive, maps approximate regions rather than precise point coordinates.
Landscape layers & symbology
Design your visual embedding space — colors, strokes, and hatch patterns — so that each semantic class is visually separable:
- Dune typology: different fills/patterns for longitudinal, crescentic, and star dunes. Consider small texture SVG patterns for print (keeps true vector quality).
- Hamada/rock plateaus: hatched texture to contrast with sand fills.
- Sabkhas: pale, slightly bluish/gray fills with a dashed hazard border on the web (popup warns about soft ground).
- Wadis: light dashed lines with “seasonal” hover content.
- Oases: point icon (palm tree) with a pop-up list of common plants.
- Protected areas: bold outline with semi-transparent fill; popup links to reserve authority.
For print, keep color ramps intentionally restrained and prefer pattern rather than saturated flat color where land cover is visually similar.
Travel, safety, and field overlays
Add a few actionable overlays that increase dwell time and provide public utility:
- Aridity mask: show hyper-arid vs. arid zones.
- Diurnal temperature extremes note: show a subtitle or pop-up indicating likely day/night delta.
- Seasonal wind events: add a “shamal” overlay (prevailing directions and periods) that warns vehicle operators and field teams.
- Service corridor layer: mark fuel/repair points and known town access for trip planning.
- Permit & protected area layer: highlight areas requiring permission and link to management agencies (data provenance shown in a pop-up).
Flora, fauna & conservation
Make wildlife an optional highlight that overlays species-relevant reserves and links to conservation pages. Use reserve polygons and add concise popups:
- Flora: xerophytes, halophytes on sabkha margins, date palms in oases.
- Fauna: gazelles, reintroduced oryx, small carnivores, reptiles, and migratory birds along coastal corridors.
Flag reintroduction/reserve success stories in popups, and where recent finds or press happened, link to reputable reporting (but do not expose sensitive locations).
When referencing press about new finds, use broad region markers and cite the outlets (a few high-quality news agencies are authoritative on published finds).
Human history & heritage layer
Add a heritage layer that contains:
- caravan routes (annotated polyline with historical note),
- rock art & archaeological zones (polygons with protected status).
DO NOT map exact coordinates for vulnerable rock art or fragile sites that are at risk of looting — instead, provide smoothed polygons or approximate bounding boxes and link to the national heritage authority or published papers for researchers.
When you call out recent discoveries in the northern desert zones, reference mainstream news outlets for the public-facing summary rather than publishing raw coordinates.

Printing & importing quick guides
Poster printing short recipe
- Choose A0 or A1 export in QGIS Composer (reproject to a UTM zone for metric accuracy).
- Export layered SVG from QGIS.
- In Illustrator, convert small annotation text to outlines if requested, but keep primary map layers editable.
- Save a print-ready PDF (CMYK if requested by the shop), include 3 mm bleed and crop marks.
- Provide a tiled A2 PDF file for shops that request smaller sub-sheets.
Import into QGIS
- Load GeoJSON → Right-click layer → Export → Reproject → Use Print Composer.
SVG → PowerPoint
- Either paste the SVG as a vector object or convert to EMF for older PowerPoint tools. Include a separate slide with a legend and credit.
Photo gallery
Include 6–10 curated images pinned as points with alt text and photographer credit. Example hero alt text and caption
- Hero alt text: “Map of the Arabian Desert showing the Empty Quarter, northern erg, and coastal sands — printable SVG & GeoJSON downloads.”
- Hero caption: “Download a printable SVG of this Arabian Desert map — includes high-res hillshade and dune polygons.”
Each pop-up must includea photographer credit, a short usage note, and a downloadable editorial-resolution JPG (while vector assets remain in the main pack).
Pros & cons
Pros:
- Interactive maps with exports can earn backlinks and extended session times.
- Vector downloads are valuable for journalists and designers, encouraging reuse and citation.
- GeoJSON files encourage academic and synthetic use.
Cons:
- Maintenance and refresh cadence required for updates.
- Licensing/commercial complexity when others want to monetize derivative works.
- Large file sizes require thoughtful hosting (CDN, range requests).
Analytics & maintenance
Treat map maintenance like model monitoring:
- Monthly or quarterly checks for new protected areas or large infrastructural changes.
- Keep a changelog and bump a version field in the manifest for each update.
- If you use an automated classification pipeline, keep a “last-run” timestamp and sample QC tiles for human review.
Printable poster quick recipe
- Prepare vector layers in a local metric CRS (UTM).
- Set dpi to 300 (or 600 for fine printed hillshade).
- Export as layered SVG; check fonts are embedded or outlined.
- Produce a tiled A2 sheet with crop marks if the print shop asks for smaller tiles.
FAQs
A: Web maps are published in WGS84 (EPSG:4326). For accurate distance measurement or large-format printing, reproject to a local metric projection (UTM appropriate to the area) in QGIS.
A: Free downloads are recommended under CC BY-SA 4.0 for editorial and academic use; contact the map publisher for commercial licenses and bespoke exports.
A: Dune extents are derived from recent satellite imagery and DEM analysis. Accuracy varies by region and season — they are suitable for educational and planning use, but should not substitute for official survey data when planning infrastructure or field operations.
A: Use the KML file for the easiest import into Google Earth.
Conclusion
Whether you need a printable poster, an embeddable interactive map, or spatial files for analysis, this map pack delivers reusable assets with clear provenance—Highlighting major sand seas like the Rub’ al Khali (Empty Quarter) and designed to be updated, cited, and shared confidently.