Introduction
This guide gives a clear, practical answer — and Everything you need to show it to others. Treating the Sahara as a single geographic entity, we map its northern sweep across Africa from the Atlantic to the Red Sea and outline the countries it touches, the landscape types it contains (dune seas, hamadas, regs, massifs), and the common area estimate (~9.2 million km², depending on definition). Whether you need a quick orientation for students, a high-impact hero image for a newsroom, or production-ready GIS assets for a website, this page translates geographic facts into usable map artifacts and best practices.
Inside, you’ll find a ready “fast answer” for quick reference, a labeled list of core countries, recommended map styles (political, satellite, topographic, climate, historical), downloadable formats (PNG, SVG, GeoJSON, GeoTIFF), and embed code (Leaflet). You’ll also get hosting and licensing tips, classroom activities, conservation overlays, and FAQs — everything formatted to be easy to publish, teach from, or embed in news and educational materials.
Quick answer — Where is the Sahara on the map?
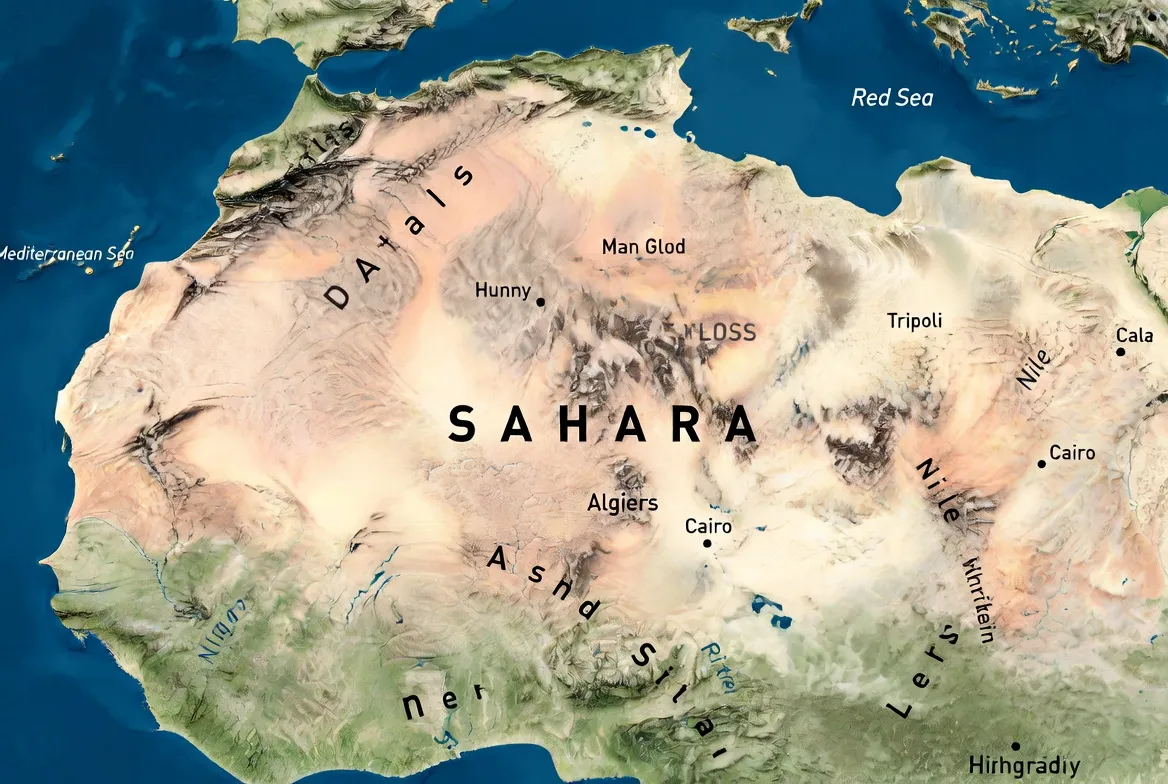
Extracted span: The Sahara occupies the northern swath of the African landmass. It extends approximately from the Atlantic seaboard in the west across to the Red Sea in the east, and from the Mediterranean’s southern fringe down toward the Sahel belt in the south. The most commonly quoted area is about 9.2 million km² (≈3.6 million sq mi) — a figure that depends on how you define the desert’s margin (aridity threshold, vegetation index, or cultural boundary)
At a glance — size, extent & key facts
- Approximate area: ~9.2 million km² (figures vary by definition; different sources apply different thresholds).
- East–West width: ≈ 4,800 km (≈3,000 miles) across the widest portion.
- Latitude band (rough): from roughly 30°N down to about 15°N; note the southern edge shifts with climatic cycles and differing operational definitions.
- Major landscape types (features): ergs (dune seas), hamadas (rock plateaus), regs (gravel plains), chotts/salt pans, wadis (seasonal dry riverbeds), and massifs (Tibesti, Ahaggar, Aïr).
Quick visual / UX tip: Use a large, responsive political base map and overlay a semi-transparent orange fill for the Sahara polygon. Offer clear CTAs under the hero image: “Download PNG” / “Download SVG” / “Download GeoJSON.” These links act like anchors in an information retrieval interface.
Countries covered by the Sahara
Treat each country intersecting the Sahara as a named entity with a numeric attribute: percent coverage. For a simple, defensible classroom or editorial list, use the eleven core countries below (west → east). These are safe to present as the Sahara’s primary overlaps in most common definitions.
Core countries (commonly listed):
- Algeria
- Mauritania
- Mali
- Morocco (southern parts)
- Western Sahara (disputed)
- Tunisia (southern parts)
- Libya
- Egypt
- Niger
- Chad
- Sudan
Notes:
- Some definitions include marginal stretches of Burkina Faso and Nigeria and small borderlands; when in doubt, mark edge areas as “variable” or include a note: “Desert edge varies by definition.”
- For classroom use, the eleven-country core list above is both simple and defensible.
Which map type to use — a quick guide framed as representation choices
Different visual encodings answer different questions. Framing the options as representation modalities will help you select the right map for the user’s intent.
Political maps
Show: Country borders, administrative boundaries, and capitals.
Best for: Orientation, classroom handouts, travel planning.
File types: PNG, SVG, GeoJSON.
Satellite maps
Show: Actual surface textures — dune fields, rocky plateaus, vegetation patches.
Best for: Hero imagery, morphological explanations, scientific features.
File types: JPEG, GeoTIFF (credit NASA/ESA).
Topographic / DEM
Show: Elevation contours, massif relief (Tibesti, Ahaggar, Aïr).
Best for: Hiking, geology, expedition planning.
File types: GeoTIFF, DEM.
Climate & precipitation maps
Show: Rainfall gradients, aridity indexes, NDVI time series.
Best for: Environmental education and desertification research.
File types: PNG overlays, GeoTIFF.
Historical / paleo maps
Show: Greener Sahara during the African Humid Period, ancient lakes and rivers.
Best for: Archaeology, paleoclimate narratives.
File types: PNG, animated GIF sliders.
How to read a Sahara map — a short primer
- Check the scale. If the scale reads 1:10,000,000, then 1 cm represents 100 km. The Sahara is vast — use insets and overview maps to avoid misinterpretation.
- Read the legend. Look for dune symbols, hamada markers, oases, chotts, and elevation contours.
- Find coordinates. A useful central point for the Sahara polygon is ~23°N, 13°E — a reasonable viewport center for a web map.
- Compare map types. Ask whether the map is answering where people are, what the surface looks like, or what the climate patterns are.
Downloadable & embeddable assets — what to host
When producing assets, provide both web-optimized and print-ready formats. Here’s a recommended set:
- Hero political map (PNG 1200×600): Label country names and major massifs. Provide an accessible alt attribute: “Sahara desert political map showing countries across North Africa.”
- Printable classroom poster (SVG + 300 dpi PNG): Include massifs, dune fields, and a simple legend.
- Satellite composite (JPEG, web-optimized): Credit NASA/ESA and include a caption template.
- Interactive GeoJSON polygon: Provide sahara_polygon_simplified.geojson (~20 KB) and sahara_polygon_detailed.geojson (~1–3 MB).
- Topographic DEM: Link to SRTM/ASTER tiles for contour generation.
- Climate rasters: Provide WorldClim or CHIRPS precipitation rasters for overlay.
Licensing & credit: Always add explicit credit lines for imagery and confirm the license for shapefiles. Natural Earth is public domain; many NASA/ESA composites are free for use with credit. SimpleMaps and other vendors may require attribution.
Map comparison table
| Map Type | Best For | File types to publish | CTA |
| Political | Classroom/orientation | PNG, SVG, GeoJSON | Download a printable political map |
| Satellite | Visual storytelling | JPEG, GeoTIFF | View high-res satellite composite |
| Topographic | Hiking/geology | GeoTIFF, DEM | Download elevation contours |
| Climate | Research/curriculum | PNG overlays, GeoTIFF | Toggle precipitation overlay |
| Historical | Paleoclimate | PNG, GIF (timeline) | Explore timeline slider |
Landscape & features — what to show on maps
- Dune seas (ergs): Grand Erg Oriental (Algeria/Tunisia), Murzuq, and Ubari dune fields (Libya). Satellite imagery highlights dune patterns and orientation.
- Rocky plateaus (hamadas): Feature them with a distinct texture or color to contrast with mobile sandfields.
- Gravel plains (regs) & salt pans (chotts): Use pale gray palettes to visually differentiate texture and albedo.
- Mountain massifs: Tibesti (Chad), Ahaggar/Hoggar (Algeria), Aïr (Niger) — mark these in topographic layers.
- Oases & lakes: Ounianga lakes (Chad) are a Prominent UNESCO site — great for biodiversity callouts and case studies.
Use-cases and audience-specific suggestions
For teachers (K–12 and university)
Worksheet idea: Label the 11 core countries, mark three mountain massifs, and ask students to compare the Sahara’s area to a familiar country (e.g., “Sahara ≈ size of China”).
Activity: Build a timeline slider showing the African Humid Period vs. present-day aridity maps.
For journalists & media
Use NASA/ESA satellite composites for hero images, provide ready captions and license notes, and suggest crop sizes for social thumbnails. Provide concise fact lines for quick newsroom copy.
For researchers & GIS users
Provide direct DEM links (SRTM) and climate rasters (WorldClim) and encourage the use of QGIS to combine layers. Publish a high-resolution GeoJSON for reproducible mapping.
For travellers & guides
Provide map layers with major routes, oases, and airports, and include clear safety notes. Recommend offline tile packs (Mapbox or OSM MBTiles) for remote navigation.
Human history & cultural overlays
Suggested overlays that add narrative depth:
- Trans-Saharan trade routes — show caravan corridors and key trade towns.
- Rock art sites — e.g., Tassili n’Ajjer (Algeria), with pointers to UNESCO metadata.
- Colonial vs. modern borders — present Western Sahara neutrally and provide a short explainer about disputes.
- Cultural-linguistic zones — Tuareg and Berber regions mapped as soft polygons.
These overlays work well as toggles on an interactive map and provide context that raises dwell time and engagement.
Environmental issues & conservation overlays
Important overlays to include are:
- Desertification / Sahel encroachment: precipitation and NDVI time-series show progressive greening or degradation.
- Dust transport plumes: seasonal dust paths are well-captured by NASA aerosol optical depth products.
- Protected areas: overlay IUCN boundaries and national parks for conservation storytelling.
- Biodiversity hotspots: species distribution models and occurrence points for conservation narratives.
Always link to primary datasets and provide provenance metadata for reproducibility.
Classroom-ready activities
- Scale exercise: Using the map scale, ask students to calculate how many centimeters on the poster correspond to a cross-continent trip.
- Compare sizes: “Is the Sahara bigger than your country?” — provide side-by-side scaled maps.
- Draw the Greener Sahara: Use paleo maps to shade ancient lakes and river terraces during the African Humid Period.
Travel & safety
- Offline navigation: Use Mapbox MBTiles or packaged OSM tiles for offline access.
- Oases & water points: Map water points, but mark many as seasonal and ephemeral.
- Temperature extremes: Provide monthly temperature charts and a diurnal swing map.
- Border risks: Mark crossing points that require permits; always link to government travel advisories and current security information.
Interesting map facts
- The Sahara is large and has a distinctive surface albedo visible in Earth observation products.
- Much of the Sahara was greener during the African Humid Period (~11,000–5,000 years ago): great content for a timeline slider.
- Some dunes reach heights of 150–180 meters; mapmakers usually show dune fields rather than individual dune height.
Table — Quick resource & data table
Table 1 — Quick resources
| Resource type | Suggested provider | What to cite/include |
| Satellite imagery | NASA Earth Observatory, ESA | Composite JPEGs + credit lines |
| Country/shapefiles | Natural Earth, SimpleMaps, GitHub GeoJSON repos | GeoJSON / Shapefile downloads (check license) |
| DEM/elevation | SRTM / ASTER | Contour generation tools, GeoTIFFs |
| Climate rasters | WorldClim / CHIRPS | Precipitation rasters for overlay |

Pros & Cons
Pros
- High search intent: phrases such as “Sahara map” or “Sahara desert on map” are common queries.
- Linkable assets: printable posters and GeoJSON attract educators and developers.
- Visual appeal: satellite imagery performs well on social media and news.
Cons
- Licensing & credit: imagery and some shapefiles require careful credit lines.
- Political sensitivity: Western Sahara and other border matters require neutral, balanced wording.
- Hosting large files: DEMs and GeoTIFFs need bandwidth and storage.
FAQS
A: Algeria, Chad, Egypt, Libya, Mali, Mauritania, Morocco, Niger, Sudan, Tunisia, and Western Sahara (disputed). The desert’s edge varies by definition.
A: Roughly 9.2 million km² (≈3.6 million sq mi). Exact numbers change with the precipitation threshold used to define the desert edge.
A: Yes — offer PNG and SVG downloads and simplified GeoJSON for web embedding. Use NASA for satellite composites and Natural Earth / SimpleMaps for shapefiles.
A: Public GIS repositories such as Natural Earth and some GitHub repos provide polygons you can convert to GeoJSON. SimpleMaps also provides simplified country shapefiles suitable for web use.
Conclusion
A well-structured pillar page that answers the query quickly and offers Downloadable assets plus interactive embeds will serve both casual searchers and professional users. Treat the Sahara polygon like an annotated entity: publish both simplified and detailed representations for different user tasks. Host GeoJSON on a fast CDN or GitHub and always include provenance metadata (source, date, license). For disputed areas like Western Sahara, use neutral language and situational notes to avoid editorial bias. Add value with historical overlays (African Humid Period), climate rasters, and classroom activities; these extras increase engagement and encourage backlinks. Finally, craft concise CTAs — “Download printable map” and “Embed interactive map” — and provide a media kit to make adoption by educators and journalists frictionless.